Understanding and Utilizing Line Graph Charts for Business and Financial Analysis
Line graph charts are a powerful tool for visualizing data over time, making them indispensable in business, finance, and marketing. These charts help in identifying trends, patterns, and anomalies, which can be crucial for decision-making and strategic planning.
What Are Line Graph Charts?
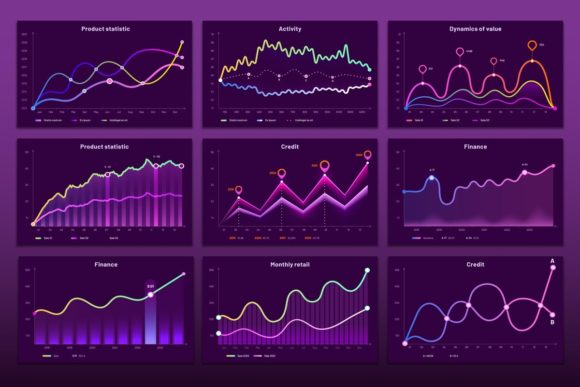
A line graph chart is a type of chart that displays information as a series of data points connected by straight line segments. It is particularly useful for showing changes over time. The x-axis (horizontal) typically represents the time scale, while the y-axis (vertical) shows the values being measured. This format makes it easy to see how one or more variables change over a specific period.
Challenges and Goals in Data Visualization
One of the primary challenges in data visualization is presenting complex data in a clear and understandable way. Businesses often need to track multiple metrics simultaneously, such as sales, expenses, and profits. Additionally, they may need to compare these metrics across different periods or against industry benchmarks. The goal is to make the data accessible and actionable, enabling better decision-making and performance tracking.
How Line Graph Charts Can Help
Line graph charts are particularly effective in addressing these challenges. They provide a clear, visual representation of data, making it easier to identify trends and patterns. For example, a business might use a line graph chart to:
- Track Sales Trends: Visualize monthly or yearly sales to identify peak and low periods.
- Monitor Financial Performance: Compare revenue, expenses, and profit margins over time to assess financial health.
- Analyze Marketing Campaigns: Measure the effectiveness of different marketing strategies by tracking engagement and conversion rates.
Practical Applications and Outcomes
The practical applications of line graph charts are vast and varied. In the context of business and finance, these charts can be used to:
- Evaluate Economic Data: Analyze economic indicators such as GDP, inflation, and unemployment rates to understand broader economic trends.
- Monitor Cryptocurrency Prices: Track the price movements of cryptocurrencies over time to make informed investment decisions.
- Conduct Analytics Analysis: Use line graph charts to visualize key performance indicators (KPIs) and other analytics data, helping to identify areas for improvement and optimization.
For instance, a company might use a line graph chart to track the performance of a new product launch. By plotting sales data over time, they can quickly see if the product is gaining traction or if adjustments are needed. Similarly, a financial analyst might use a line graph chart to monitor the stock market, identifying trends and making predictions based on historical data.
Different Approaches for Different Users
While line graph charts are a versatile tool, different users may approach them in various ways depending on their specific needs and goals. Here are some considerations for different user groups:
- Business Executives: Focus on high-level trends and overall performance. Use line graph charts to present key insights and support strategic decisions.
- Financial Analysts: Delve into detailed data and perform in-depth analysis. Use line graph charts to identify subtle patterns and correlations that can inform financial strategies.
- Marketing Professionals: Use line graph charts to track campaign performance and customer engagement. This can help in optimizing marketing efforts and improving ROI.
Usefulness and Implementation
To make the most of line graph charts, it's important to follow best practices in data visualization. Here are some recommendations:
- Choose the Right Scale: Ensure the scale on the axes is appropriate for the data being presented. This helps in accurately representing the data and avoiding misleading visuals.
- Use Clear Labels and Legends: Clearly label the axes and include a legend if multiple data sets are being compared. This makes the chart easier to read and understand.
- Highlight Key Data Points: Use markers or annotations to highlight significant data points or trends. This draws attention to the most important information.
- Keep It Simple: Avoid cluttering the chart with too much information. A clean, simple design is often more effective in communicating the data.
In conclusion, line graph charts are a valuable tool for anyone looking to visualize and analyze data over time. Whether you're a business executive, a financial analyst, or a marketing professional, these charts can help you make sense of complex data and drive better outcomes. By following best practices and tailoring the charts to your specific needs, you can unlock the full potential of line graph charts in your work.